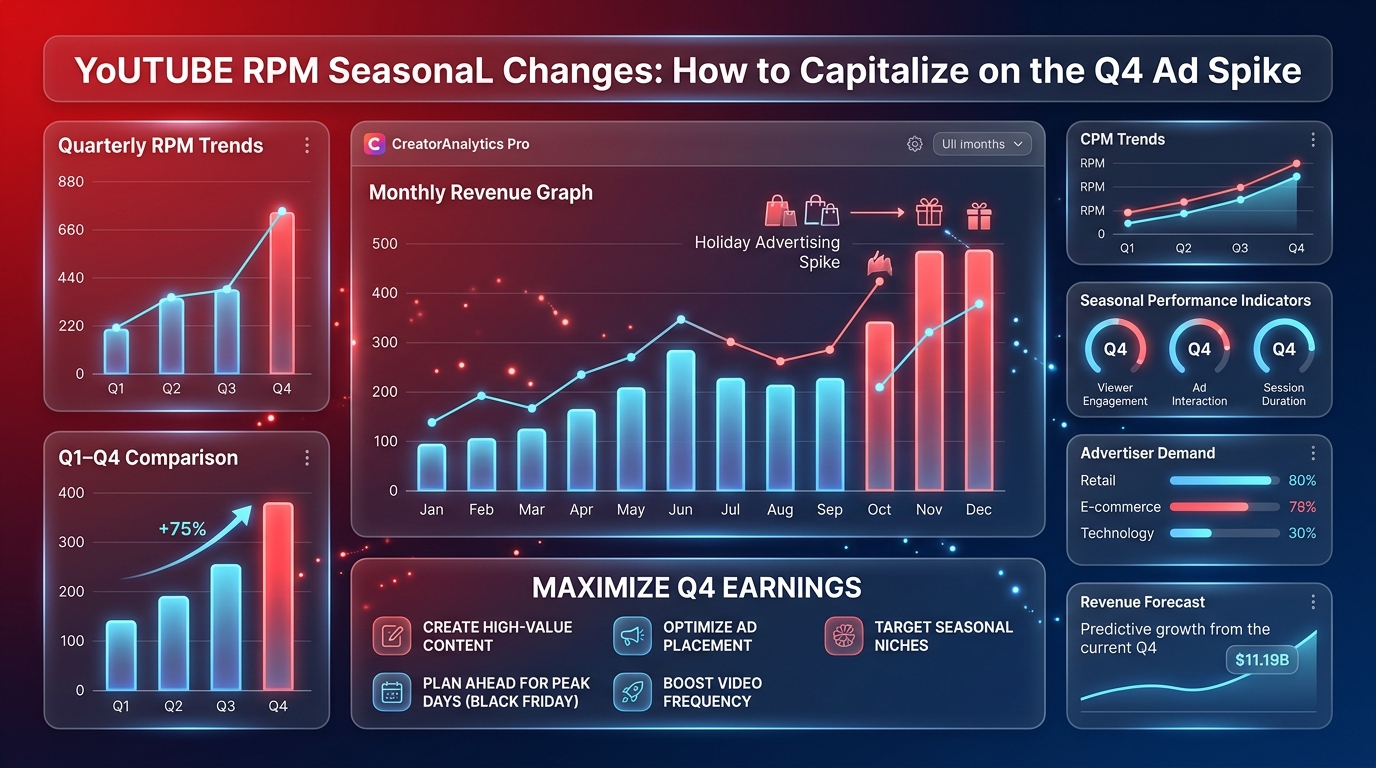
If you track your YouTube Studio RPM dashboard closely, you will notice something that happens with clockwork predictability every single year: your earnings per thousand views collapse in January, slowly recover through spring and summer, then explode upward in October and November before peaking in December.
This is not a glitch. It is not your content getting worse or better. It is the annual advertiser budget cycle — the single most powerful external force shaping your YouTube revenue — and understanding it is the difference between panicking every January and planning every Q4 like a business owner.
🔧 Recommended ChafikTech Tool
Use it for seasonal forecasting: Run the calculator four times — once for each quarter using the seasonal RPM multipliers from this article. The resulting four-scenario model gives you a complete annual revenue forecast that accounts for the predictable Q1 crash and Q4 spike, allowing you to budget your creator business correctly year-round. See our Advanced Forecasting Guide for a full walkthrough.
Why Advertiser Budgets Control Your RPM
YouTube's ad system is a real-time auction. Every time a viewer watches your video, advertisers compete for the ad slots. What drives the price up or down is not your content — it is how many advertisers are participating in the auction and how aggressively they are bidding.
Corporate marketing departments receive quarterly budget allocations. In Q4, they must spend their entire annual holiday campaign budget before December 31st or lose it for next year. This creates a massive surge of advertiser dollars flooding into the YouTube auction simultaneously, driving bids — and therefore your RPM — to their yearly peak.
In January, those same marketing departments have just been handed fresh annual budgets and are still in the planning and approval phase. Fewer advertisers are running campaigns, bids plummet, and your RPM collapses even if your views stay identical.
The Four Quarters: What to Expect Each Season
Q1 (January–March): The Slump
Expected RPM change: 40–55% below your channel average.
Reason: Annual budget reset. Advertisers are in planning mode. Post-holiday consumer spending drops. Audience is also smaller as people return to work routines and spend less time on screens.
Strategy: Use Q1 for experimentation. Test new content formats, series concepts, and thumbnails without the financial pressure of peak RPM months. The lower stakes make Q1 ideal for creative risk-taking.
Q2 (April–June): The Recovery
Expected RPM change: 15–25% below your channel average.
Reason: Budgets are approved and deployed. Spring and summer product campaigns (travel, home improvement, fashion) enter the auction.
Strategy: Rebuild consistent upload cadence. Focus on evergreen content that will accumulate views throughout the year. Content published in Q2 is perfectly timed to rank and generate revenue during the high-RPM Q3/Q4 window.
Q3 (July–September): The Plateau
Expected RPM change: Near channel average, slight positive lift in September.
Reason: Steady advertiser spending. Back-to-school campaigns (electronics, stationery, software) provide a September boost. Q3 is also when tech companies begin their fall product launch campaigns.
Strategy: Maximize output. Publish your most ambitious content. Videos uploaded in Q3 will be at full search ranking strength by the time Q4 elevated RPMs arrive.
Q4 (October–December): The Golden Quarter
Expected RPM change: 50–175% above your channel average. Peak typically hits November 20–December 10.
Reason: Black Friday, Cyber Monday, and Christmas campaigns flood the ad auction. Every retailer, software company, and brand with a holiday offer is bidding aggressively for viewer attention.
Strategy: This is your financial harvest season. Publish your highest-effort, most search-optimized content. Every video uploaded in October–November benefits from premium ad rates for its entire first month of traffic.
The Seasonal RPM Multiplier Table
| Month | Typical RPM Multiplier | Key Events Affecting Bids |
|---|---|---|
| January | 0.50–0.60× | Budget reset, post-holiday lull |
| February | 0.55–0.65× | Valentine's Day micro-lift |
| March | 0.65–0.75× | Tax season begins (finance niche spike) |
| April | 0.75–0.85× | Spring campaigns, tax filing deadline |
| May | 0.80–0.90× | Mother's Day, graduation campaigns |
| June | 0.85–0.95× | Summer travel, Father's Day |
| July | 0.85–0.95× | Summer lull for B2B, strong consumer |
| August | 0.85–0.95× | Back-to-school early campaigns |
| September | 0.95–1.10× | Back-to-school peak, tech launches |
| October | 1.15–1.40× | Q4 campaign launches, Halloween |
| November | 1.50–2.00× | Black Friday, Cyber Monday — peak spend |
| December | 1.40–1.80× | Christmas campaigns, year-end budget flush |
How to Strategically Plan Your Content Calendar
The "Plant in Summer, Harvest in Q4" Method
SEO-driven YouTube content takes 60–120 days to reach its peak search ranking. A video uploaded in August will typically reach maximum organic search impressions in October or November — exactly when RPMs are at their yearly peak. This timing effect means Q3 is your most strategically important publishing window even though the RPM is only average.
High-Value Q4 Content Topics by Niche
- Tech: "Best laptops under $X for 2026," "Top gift ideas for tech lovers," product comparison videos that directly support buyer decisions
- Finance: "Year-end tax optimization," "Best investment accounts to open before December 31," "2027 financial planning guide"
- Fitness: "New Year transformation plans" published in late November capture pre-New Year resolution traffic at Q4 RPMs
- Gaming: Holiday gift guides, new game reviews, "games to play during Christmas break" listicles
Frequently Asked Questions
Conclusion
The seasonal rhythm of YouTube ad revenue is one of the most predictable patterns in the creator economy. Q1 will always be lean; Q4 will always be abundant. The creators who thrive year-round are those who plan for both — banking their Q4 windfall, publishing their best content in Q3 to capture Q4 RPMs, and using Q1's lean months for creative experimentation.
Build your seasonal forecast using our YouTube Earnings Calculator and the multipliers from this guide. Treat your Q4 content calendar as your most important business planning activity of the year.