Table of Contents
Website speed used to be a matter of good user experience. In 2026, it is a direct Google ranking signal, a conversion rate multiplier, and for publishers, a direct determinant of advertising revenue. A slow website is not just annoying — it is a financially measurable problem that costs you rankings, visitors, and dollars every single day.
This guide explains what website performance tests measure, why the numbers matter, and the specific actions you can take to improve both your speed scores and your earnings.
🔧 Recommended ChafikTech Tool
Slow websites lose ad impressions because ads require JavaScript to load — and if your page is slow, ads often fail to render before users abandon the page. Use our AdSense Audit Tool to identify if your current ad configuration is contributing to poor performance scores and lost revenue.
The Business Case for Website Speed
The speed-revenue relationship is well-documented by the largest companies in the world:
For a publisher running AdSense, every user who abandons before the page loads is an impression lost. At scale, this matters enormously. A site with 100,000 monthly mobile visitors and a 4-second load time could be losing 40,000+ ad impressions per month to abandonment alone.
How to Run a Website Performance Test
Tool 1: Google PageSpeed Insights (Primary Test)
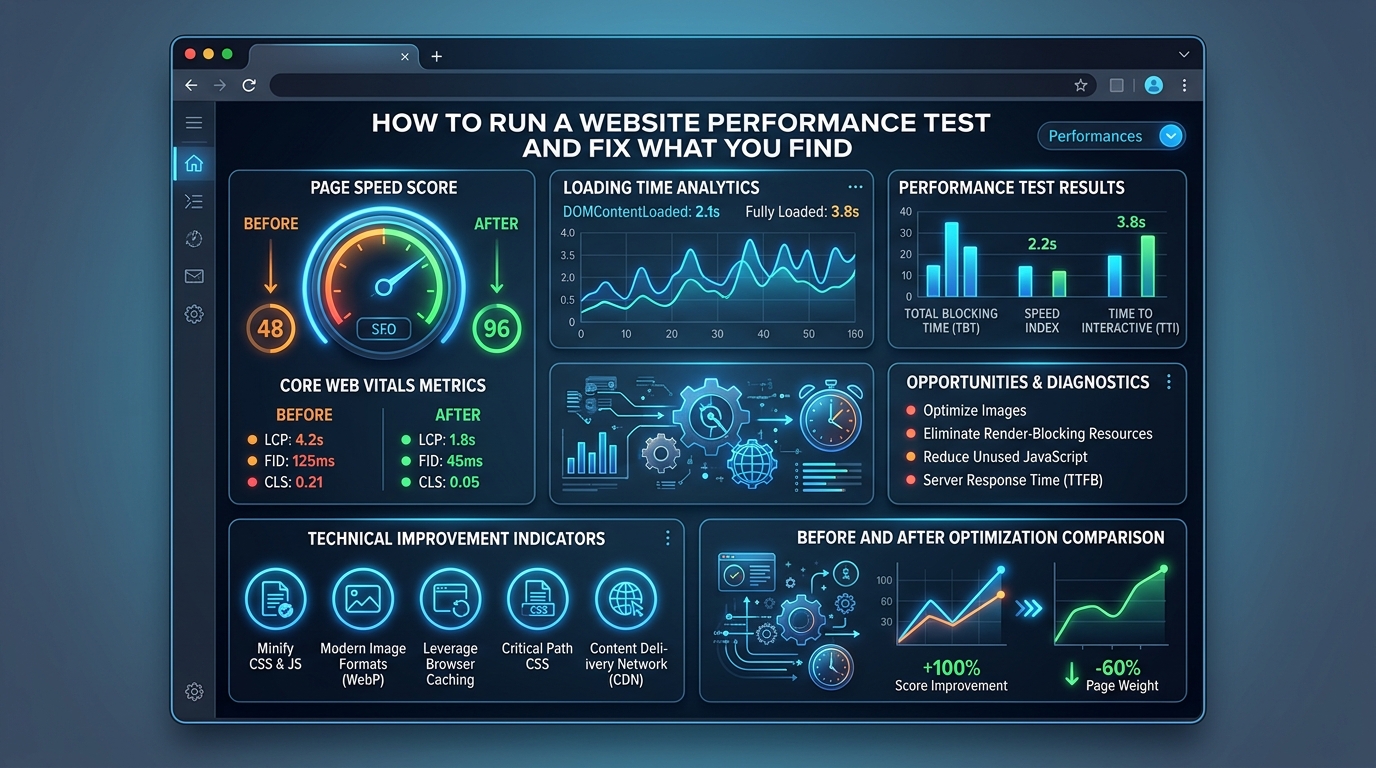
Go to pagespeed.web.dev and enter any URL. Within seconds, you'll receive two separate reports: one for Mobile and one for Desktop. The report contains:
- Core Web Vitals Assessment: Pass/Fail for LCP, INP, and CLS (the three metrics Google uses as ranking factors).
- Performance Score (0–100): A composite lab score. Anything above 90 is "Good." Below 50 is "Poor."
- Diagnostics: A prioritized list of specific files and elements causing the slowdown, with estimated impact on your score.
Always prioritize the Mobile report — Google's Mobile-First Indexing means your mobile performance determines your search ranking.
Tool 2: GTmetrix (Detailed Waterfall Analysis)
GTmetrix provides a visual "waterfall" chart showing every single resource your page loads (HTML, CSS, JavaScript, images, fonts, third-party scripts) in the exact order and timing they download. This is invaluable for identifying which specific elements are blocking page rendering.
Free users can test from one geographic location. Paid plans allow testing from locations closest to your target audience, which is important if your readers are primarily from a specific country.
Tool 3: WebPageTest (Advanced Professional Testing)
WebPageTest is the tool professional developers use. It offers filmstrip views (screenshots of the page at every 0.5-second interval during loading), connection throttling, custom scripting, and multi-location testing. For most bloggers, GTmetrix is sufficient, but WebPageTest is the gold standard for precise performance debugging.
Understanding Your Performance Score
| Metric | Good | Needs Work | Poor |
|---|---|---|---|
| LCP (Load time of largest element) | Under 2.5s | 2.5s – 4.0s | Over 4.0s |
| INP (Response to interactions) | Under 200ms | 200ms – 500ms | Over 500ms |
| CLS (Visual stability score) | Under 0.1 | 0.1 – 0.25 | Over 0.25 |
| TTFB (Time to first server byte) | Under 800ms | 800ms – 1800ms | Over 1800ms |
The Top 5 Actions That Improve Performance Scores
1. Compress and Convert Images to WebP
Images are almost always the single largest contributor to page weight. Converting your hero image from JPEG (300KB) to WebP (60KB) and ensuring correct size attributes prevent Largest Contentful Paint (LCP) failures. Use tools like Squoosh or ShortPixel for bulk conversion.
2. Enable Caching on Your Server
Browser caching stores static assets (images, CSS, JavaScript) in the visitor's browser. On return visits, those assets don't need to re-download. Server-side caching (via tools like Cloudflare or WordPress caching plugins like WP Rocket) serves pre-rendered HTML pages instead of processing PHP/database queries on every visit.
3. Defer Non-Critical JavaScript
Every JavaScript file that loads synchronously in the <head> blocks the browser from rendering the page until that script finishes downloading and executing. Adding defer or async attributes to non-critical scripts allows the page to render first and load scripts after — dramatically improving First Contentful Paint (FCP) and LCP times.
4. Use a Content Delivery Network (CDN)
A CDN stores copies of your static assets (images, CSS, JS) on servers in dozens of geographic locations worldwide. When a visitor in Australia visits your US-hosted site, they receive your images from an Australian CDN node instead of a New York server — reducing the physical data travel time by thousands of kilometers and hundreds of milliseconds.
5. Optimize Ad Loading
Google AdSense's auto-ads script is a known performance killer because it injects ads dynamically after the page loads, which causes Cumulative Layout Shift (CLS). Manually defining fixed-height ad containers in your HTML prevents content from jumping when ads load. Also, consider lazy-loading below-the-fold ad slots.
Performance Testing Tool Comparison
| Tool | Best Used For | Key Metric Reported | Score Threshold (Good) |
|---|---|---|---|
| PageSpeed Insights | Official Google score, Core Web Vitals pass/fail | Performance Score (0–100) | 90+ (Green) |
| GTmetrix | Waterfall chart, identifying render-blocking resources | LCP, TBT, CLS | Grade A or B |
| WebPageTest | Advanced testing from real browsers in specific cities | TTFB, Speed Index | TTFB < 600ms |
Common Testing Mistakes
- Only Testing Desktop: Google's ranking algorithm uses Mobile-First Indexing. Your desktop score may be 92/100 while your mobile score is 45/100. Always test both — the mobile score is what matters for rankings.
- Testing with Extensions Active: Browser extensions (ad blockers, password managers) add load time to your tests. Always run performance tests in a clean incognito window for accurate results.
Best Practices
- Fix TTFB First: Time To First Byte (TTFB) is determined by your server speed. If your TTFB is over 600ms, no amount of image optimization will make your site feel fast. Upgrade your hosting first.
- Compress Images to WebP: Converting all images from PNG/JPG to WebP format typically reduces image file sizes by 25–35% with no visible quality loss, directly improving your LCP score.
💡 See How Speed Affects Revenue
A faster site earns more: better rankings, lower bounce rates, and higher ad viewability. Estimate the revenue impact of a 20% traffic increase using the Website AdSense Calculator.
Frequently Asked Questions
head and prevents the browser from displaying any visible content until that file finishes downloading. The more render-blocking files you have, the longer users see a blank white screen. Eliminating or deferring these files is one of the highest-impact performance improvements available.Conclusion
Website performance is no longer a technical nicety — it is a business imperative. Slow websites pay a compounding penalty: lower rankings, higher bounce rates, fewer ad impressions, and ultimately less revenue. Run a performance test on your site today using PageSpeed Insights, identify the top 3 issues in the Diagnostics section, and fix them in order of estimated impact. Use our AdSense Audit Tool to ensure your speed improvements are also maximizing your ad revenue potential.