Table of Contents
Most publishers use a website earnings calculator for a quick dopamine hit. They type in "1,000,000 pageviews" just to see a massive monthly revenue number, close the tab, and go back to writing content without a real strategy.
But professional publishers and website flippers use earnings calculators differently. They use them to build 12-month revenue forecasting models, adjust for advertiser seasonality, and calculate the exact enterprise value of their digital assets before selling them.
In this comprehensive guide, we will show you how to move beyond basic math. You will learn how to use an earnings calculator to accurately predict your website's financial future, adjust for the inevitable Q1 advertising slump, and determine exactly how much your website is worth if you decided to sell it today.
Recommended ChafikTech Tool
Why you need it: To build an accurate forecasting model, you need a calculator that processes traffic, RPM, and fill rate dynamically.
How it works: You input your monthly pageviews, your niche's average RPM, and your ad fill rate. The tool instantly calculates your daily, monthly, and yearly projected revenue, allowing you to run multiple "what-if" scenarios for your business plan.
The Three Pillars of Revenue Forecasting
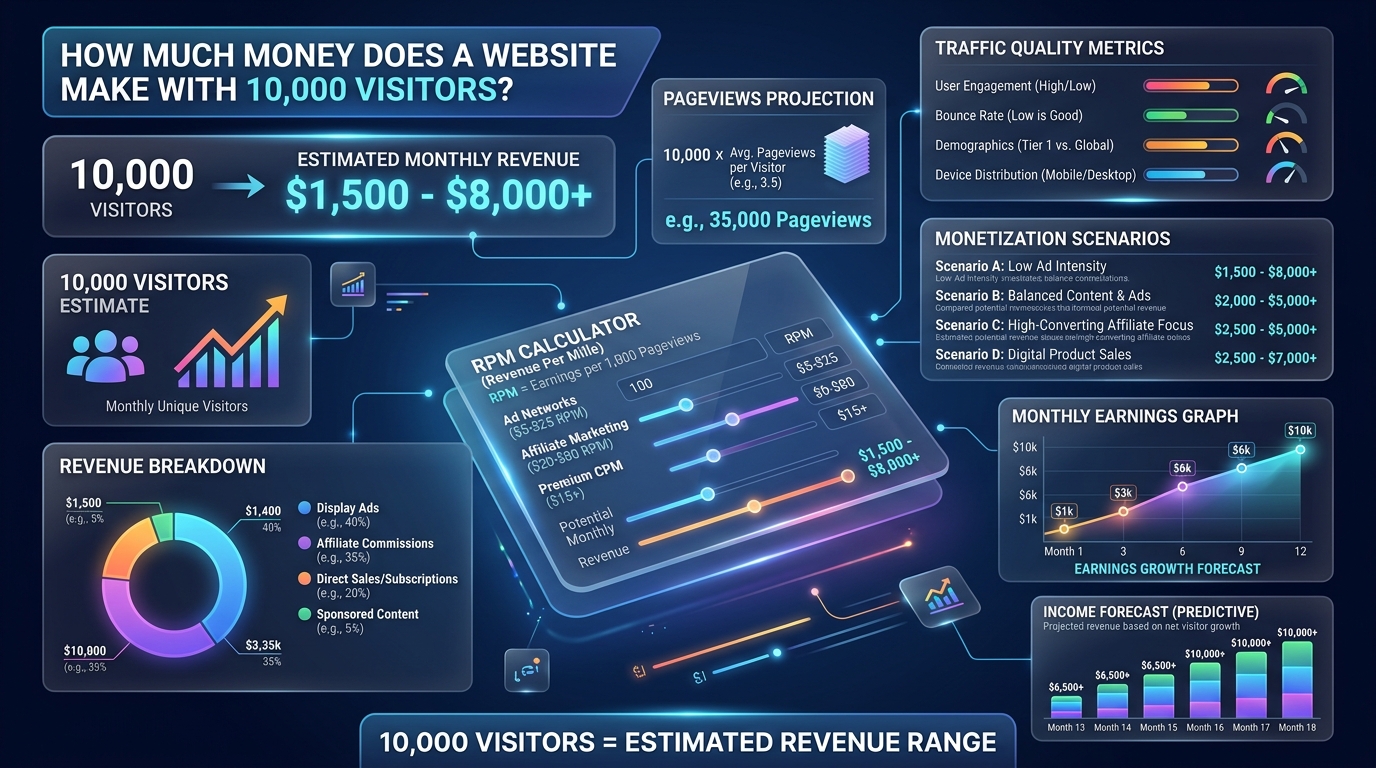
Before you can accurately estimate your monthly revenue, you must stop relying on broad industry averages and start inputting your site's specific metrics into the calculator. A reliable forecast requires three precise data points:
1. Projected Pageviews (Not Sessions or Users)
Revenue calculators operate on ad impressions, which are tied directly to page loads. A user (visitor) might trigger three pageviews during one session. Therefore, always input your 30-day trailing Pageview count from Google Analytics. If you use sessions or unique users, your revenue estimate will be mathematically flawed and artificially low.
2. Geographically Adjusted RPM
RPM (Revenue Per Mille) is the amount you earn per 1,000 pageviews. However, a "tech blog" does not have a single universal RPM. A tech blog with US traffic might have a $25 RPM, while the exact same blog with Indian traffic might have a $2 RPM.
When inputting your RPM into a calculator, you must use a geographically weighted average. If you are unsure what your regional RPM should be, consult our live RPM Data by Country database to find accurate baseline figures for your audience demographic before running your calculation.
3. Ad Fill Rate (Coverage)
Beginners assume that 100% of their pageviews will display ads. In reality, ad blockers, slow page load speeds, and lack of advertiser inventory mean your fill rate will likely sit between 75% and 90%. Always set your calculator's fill rate to 85% for a conservative, realistic forecast.
How to Build a 12-Month Revenue Calendar
A static calculation is only accurate for the exact month you run it. To treat your website like a business, you need a 12-month revenue calendar. This involves running the calculator multiple times to account for advertising seasonality.
Advertiser budgets do not remain flat throughout the year. They operate on a quarterly cycle that severely impacts your RPM:
- Q1 (January - March): The Slump. Advertisers are finalizing annual budgets. January RPMs often drop 30% to 50% compared to December. When forecasting Q1 revenue, decrease your baseline RPM input by 35%.
- Q2 (April - June): The Recovery. Budgets are deployed. Traffic and RPMs stabilize to your niche's average baseline.
- Q3 (July - September): The Plateau. Steady performance, though late summer (August) can see minor dips due to consumer vacations.
- Q4 (October - December): The Spike. Retailers dump massive budgets into Black Friday, Cyber Monday, and Christmas advertising. When forecasting Q4, increase your baseline RPM input by 40% to 60%.
If your baseline RPM is $10, your calculator input for January should be $6.50, and your input for November should be $15.00. Failing to account for seasonality is the number one reason publishers face cash flow crises early in the year.
Using the Calculator for Website Valuation (Flipping)
An earnings calculator isn't just for predicting next month's paycheck; it is the fundamental tool for valuing your digital asset if you want to sell it.
Website brokers like Empire Flippers or Motion Invest value content sites based on a multiple of their average monthly net profit. The industry standard formula is:
Website Value = (Average Monthly Net Profit over last 6-12 months) × (Multiple between 30x and 45x)
| Calculator Output (Monthly Rev) | Estimated Monthly Expenses | Monthly Net Profit | Valuation (35x Multiple) |
|---|---|---|---|
| $500 | $50 (Hosting, Tools) | $450 | $15,750 |
| $2,000 | $150 (Hosting, Content) | $1,850 | $64,750 |
| $10,000 | $1,500 (Team, SaaS) | $8,500 | $297,500 |
By using the earnings calculator to project your revenue 12 months into the future, you can estimate exactly what your website will be worth next year. This allows you to make strategic decisions: Should I sell the site now for $60k, or reinvest in content to reach the $10,000/month mark and sell it for $300k next year?
Common Forecasting Mistakes to Avoid
When using an earnings calculator, avoid these critical errors that lead to wild overestimations:
- Assuming Linear Growth: Traffic does not grow in a straight line. Google algorithm updates happen. Calculate your revenue based on your current traffic plateau, not the aggressive 20% month-over-month growth you hope to achieve.
- Ignoring Tier 3 Traffic Dilution: If an article goes viral in a region with a very low RPM, your overall pageviews will spike, but your blended average RPM will plummet. As discussed in our highest paying countries guide, all pageviews are not created equal.
- Forgetting About Ad Blockers: Approximately 25% of global internet users employ ad blockers. If your niche is highly technical (like software development), this number can exceed 50%. A good calculator allows you to adjust the "Fill Rate" to account for this invisible loss.
Example: 12-Month Content ROI Forecast
| Month | New Articles Published | Est. Monthly Traffic | Projected Revenue ($15 RPM) |
|---|---|---|---|
| Month 3 (Sandbox) | 30 | 5,000 | $75 |
| Month 6 (Traction) | 60 | 25,000 | $375 |
| Month 9 (Growth) | 90 | 60,000 | $900 (Eligible for Premium Ads) |
| Month 12 (Authority) | 120 | 120,000 | $3,000 (RPM jumped to $25) |
Common Forecasting Mistakes
- Assuming Linear Growth: Website traffic does not grow in a straight line. It stays flat for 6 months, spikes after a Google update, then levels out. Do not forecast straight-line growth.
- Ignoring Content Decay: Old articles slowly lose traffic over time as competitors publish newer information. A good model accounts for a 10-20% traffic decay on posts older than 18 months.
Best Practices
- Model "Worst Case" Scenarios: Always have a financial model for what happens if your traffic drops by 40% due to a Google algorithm update. Ensure your hosting and plugin expenses can survive a dry spell.
- Track Revenue per Article (RPA): Take your total monthly earnings and divide it by your total published articles. If your RPA is $10, you know exactly how many articles you need to write to reach a specific income goal.
📈 Build Your Forecast
You don't need a complex Excel spreadsheet to run basic projections. Use the Website AdSense Calculator to model different RPM scenarios instantly.
Frequently Asked Questions
Conclusion
A website earnings calculator is much more than a novelty tool for daydreaming about wealth. When used correctly, it is the financial compass for your digital publishing business.
By inputting precise pageview metrics, geographically adjusted RPMs, and accounting for quarterly advertiser seasonality, you can map out a reliable 12-month revenue forecast. Stop guessing how much your website might make next month. Run the numbers, build the model, and start treating your content portfolio like the valuable digital asset it truly is.