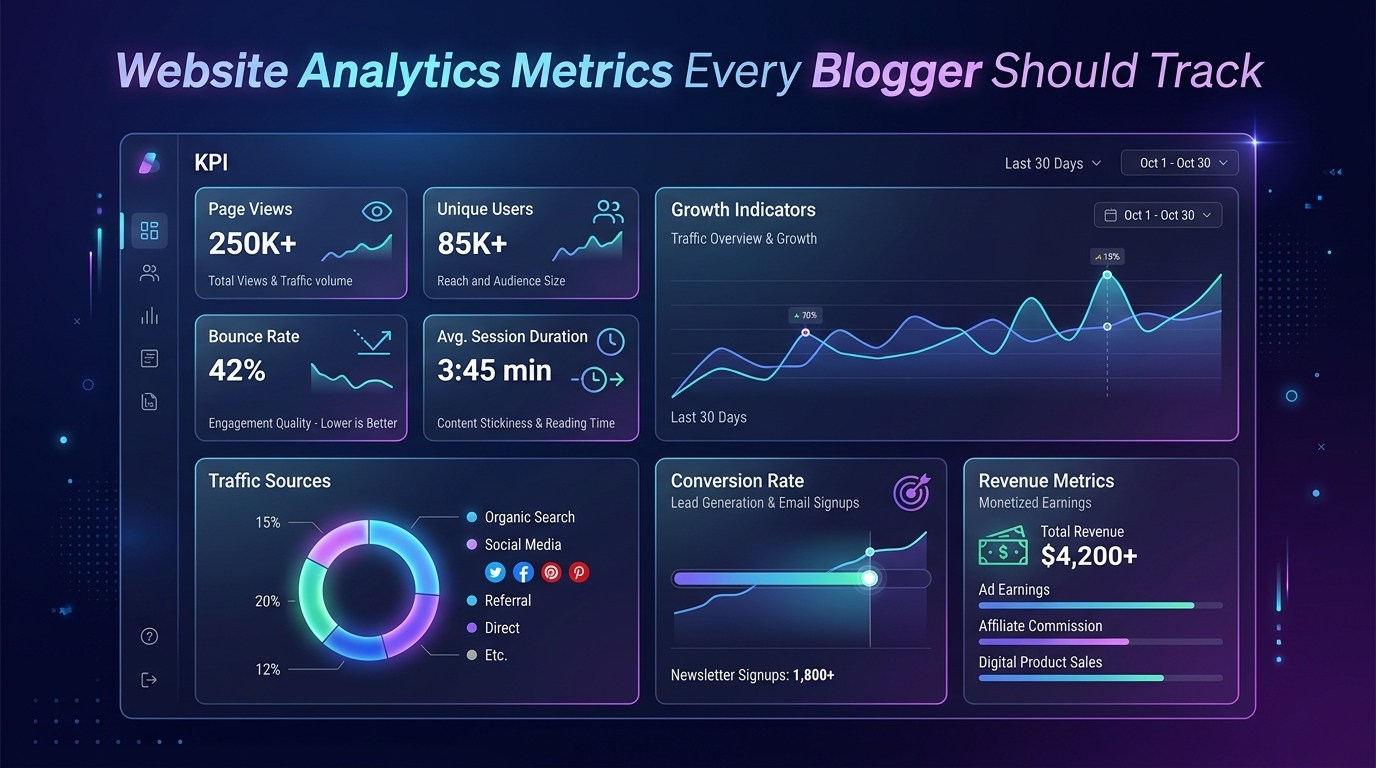
Most bloggers open their analytics dashboard, see the traffic number going up or down, and close the tab. This is the equivalent of a pilot checking only the altitude gauge while ignoring fuel level, airspeed, and engine temperature. Your website analytics contain a complete diagnostic map of your site's health, content performance, and revenue potential — but only if you know which specific metrics to monitor and what they are telling you.
This guide breaks down the 12 most critical analytics metrics for bloggers, explains what each one means, what a "good" benchmark looks like, and what to do when the numbers are moving in the wrong direction.
Traffic & Audience Metrics
1. Sessions (Monthly)
A session is a single visit to your website, regardless of how many pages are viewed. Monitor month-over-month growth as your primary growth indicator. A healthy content-focused website should target 10–20% month-over-month growth in the first year. Flat or declining sessions require immediate content or SEO investigation.
2. Users vs. New Users
Total Users is the count of unique individuals who visited. New Users is the subset making their first visit. A site with 80% new users is almost entirely traffic-dependent on external discovery (search, social). A healthy mix includes 20–30% returning users, indicating an audience that bookmarks and revisits your content.
3. Traffic Channel Breakdown
In GA4, find this under Reports → Acquisition → Traffic Acquisition. This shows what percentage of traffic comes from Organic Search, Direct, Social, Referral, Email, and Paid. Organic search should ideally represent 60%+ of traffic for a sustainable, algorithm-resistant business. High social traffic is volatile and less advertisable.
4. Geographic Distribution
Find this under Reports → Demographics → Geographic. The percentage of your traffic from Tier 1 countries (USA, UK, Canada, Australia) directly correlates to your AdSense RPM. A site with 70% US traffic will earn 3–5x more per 1,000 visitors than an identical site with 70% Southeast Asian traffic.
Engagement & Quality Metrics
5. Engagement Rate (GA4 Replacement for Bounce Rate)
In GA4, "Engagement Rate" replaced the old bounce rate metric. An engaged session is one that lasts at least 10 seconds, has a conversion event, or views 2+ pages. Aim for an engagement rate above 50%. If yours is below 40%, users are arriving and leaving immediately — a signal that your content does not match the search intent that brought them.
6. Average Engagement Time per Session
How long users actively engage with your page (not just have the tab open). For long-form blog articles, a healthy benchmark is 2–4 minutes. If your average is under 60 seconds on articles that take 10 minutes to read, users are not reading — they are scanning and leaving. This signals a content quality or formatting issue.
7. Pages per Session
The average number of pages a user visits in a single session. For a site monetized with display ads, this is a direct revenue multiplier. Increasing pages per session from 1.3 to 1.8 means 38% more pageviews (and ad impressions) from the exact same number of visitors. Strategic internal linking is the primary driver of this metric.
Content Performance Metrics
8. Top Landing Pages
In GA4, navigate to Reports → Engagement → Landing Page. This shows which pages are the "entry point" for users arriving from search, social, or referral. Your top 5 landing pages are generating the most first-impressions — optimize them for engagement, internal linking, and ad placement first.
9. Top Organic Search Keywords (from Google Search Console)
GA4 doesn't show specific keywords directly — you need Google Search Console for this. In GSC, under Performance, sort by Impressions to find high-impression keywords you rank for but have low click-through rates (CTR). These are opportunities to improve your title tag and meta description to win more clicks from your existing rankings.
Monetization Metrics
10. RPM (Revenue Per 1,000 Impressions) — from AdSense Dashboard
This is your primary revenue efficiency metric. Divide your total AdSense earnings by total page impressions and multiply by 1,000. Track this weekly. If your RPM drops significantly, investigate: Was there an advertiser budget pullback? Did your audience geographic mix change? Did you add ad placements that dilute existing slot performance?
11. Ad Click-Through Rate (CTR) — from AdSense Dashboard
The percentage of users who click an ad. An unusually high CTR (above 2%) can trigger an invalid clicks investigation by Google. A very low CTR (below 0.1%) indicates poor ad placement. The sweet spot for healthy AdSense CTR is typically 0.3%–1.0%.
12. Scroll Depth (via GA4 Enhanced Events)
GA4 automatically tracks a scroll event when users reach 90% of your page. If only 20% of users reach 90% depth on a long article, 80% are not reading to the conclusion — the section where many publishers place their most prominent ad units. Short paragraphs, subheadings, and visual breaks improve scroll depth.
Your Monthly Analytics Review Checklist
| Metric | Review Frequency | Target Trend |
|---|
| Total Sessions | Weekly | Month-over-month growth |
| Traffic Channel Split | Monthly | Organic % increasing |
| Engagement Rate | Monthly | Above 50% |
| Pages per Session | Monthly | Above 1.5 |
| US/UK Traffic % | Monthly | Increasing or stable |
| AdSense RPM | Weekly | Stable or increasing |
| Top Landing Pages | Monthly | New pages entering top 10 |
Vanity Metrics vs Actionable Metrics
| Metric Type |
The Metric |
Why You Should (or Shouldn't) Care |
| Vanity (Ignore) | Raw "Hits" | Includes bot traffic and server pings. Completely meaningless for revenue. |
| Vanity (Ignore) | Total Registered Users | If they never log in, they don't generate ad impressions. |
| Actionable (Focus) | Pages per Session | Directly correlates to total pageviews and display ad revenue. |
| Actionable (Focus) | Bounce Rate (by Channel) | Tells you if your SEO traffic is actually finding what they searched for. |
Common Tracking Mistakes
- Tracking Your Own Visits: If you don't filter your own IP address out of Google Analytics, every time you refresh a page to check a typo, you artificially inflate your pageviews and lower your average time on page.
- Obsessing Over Daily Traffic: Checking analytics every 3 hours leads to emotional burnout. SEO is seasonal and cyclical. Look at year-over-year or month-over-month trends instead.
Best Practices
- Set Up Conversion Goals: Don't just track pageviews. Set up a goal in Google Analytics to track how many people click your highest-paying affiliate link or join your email newsletter.
- Segment Your Traffic: Always view your bounce rate segmented by device. A 90% bounce rate on mobile while desktop is at 40% immediately tells you your mobile site is broken or too slow.
Frequently Asked Questions
Q: Should I use GA4 or keep Universal Analytics?
A: Universal Analytics was sunset by Google in 2023. GA4 is the only supported version. If you haven't migrated yet, you are collecting no historical data and will have no baseline to compare against. Set up GA4 immediately and review the new interface — it is different from Universal Analytics but more powerful once learned.
Q: What does "direct" traffic mean in GA4 and why is it often inaccurate?
A: "Direct" traffic is sessions where GA4 couldn't determine the source — the user typed the URL directly, used a bookmark, or came from a source with no referral tracking. It is also a catch-all for traffic from dark social (WhatsApp, Slack, email without UTM tags). Very high direct traffic often indicates a UTM parameter tracking problem.
Q: My traffic is growing but my AdSense revenue is flat. Why?
A: Several causes are common: (1) New traffic may be coming from lower-paying countries. (2) New visitors may be landing on lower-quality ad placement pages. (3) RPM may have dropped due to seasonal advertiser budget cuts (January and February are typically lowest RPM months). Analyze your traffic geographic split and RPM trend simultaneously.
Q: How do I reduce bounce rate effectively?
A: In GA4 terms, increase engagement rate. The most effective tactics: ensure your content matches search intent exactly (don't mislead users with clickbait titles), load your page fast (slow pages cause immediate abandonment), provide a compelling hook in the first paragraph, and place visible internal links to related content early in the article.
Q: How do I track AdSense revenue in GA4?
A: Link your Google AdSense account to GA4 via the Admin settings. Once linked, GA4 shows publisher revenue alongside traffic metrics, allowing you to see revenue per page, revenue by traffic source, and revenue by country — giving you a much more complete picture of which traffic is actually monetizable.
Q: What is a "session" in GA4 vs. a "user"?
A: A user is the individual visitor (identified by a cookie or login). A session is a single visit by that user. One user can create multiple sessions (e.g., visiting on Monday and again on Friday = 1 user, 2 sessions). For advertising purposes, sessions and pageviews are more important metrics than unique users.
Q: What is a good traffic growth rate for a new blog?
A: For a new blog in its first year, 10–20% month-over-month growth is achievable with consistent content publication and SEO. In months 6–12, some blogs experience a "Google sandbox breakout" where traffic suddenly accelerates as the domain accumulates trust. Do not judge a new blog's performance by month 1–3 numbers alone.
Q: Should I monitor competitor analytics or only my own?
A: Both. Track your own site weekly for operational decisions. Review competitor estimated traffic (via SimilarWeb or Ahrefs) monthly for strategic decisions — understanding if your niche's overall traffic is growing or if specific competitors are gaining market share at your expense.
Conclusion
Analytics without interpretation is just numbers. The 12 metrics in this guide give you a complete operational view of your blog's performance: how many people are visiting, where they come from, how they engage, and how much revenue each visitor generates. Review them on a consistent schedule, establish baselines, and track trends over time. Then use our Website AdSense Calculator to translate your traffic analytics into projected monthly earnings targets.
Website AnalyticsGoogle Analytics 4Blog MetricsTraffic TrackingEngagement RateAdSense RPMSessions AnalyticsPages Per SessionBounce RateBlog Revenue